> For the complete documentation index, see [llms.txt](https://docs.payrexx.com/platform/llms.txt). Markdown versions of documentation pages are available by appending `.md` to page URLs; this page is available as [Markdown](https://docs.payrexx.com/platform/backoffice/dashboard.md).
# Dashboard
Dieser Artikel befasst sich mit dem Dashboard, der Einstiegsseite der Plattform-Administration Deines Payrexx-Kontos.
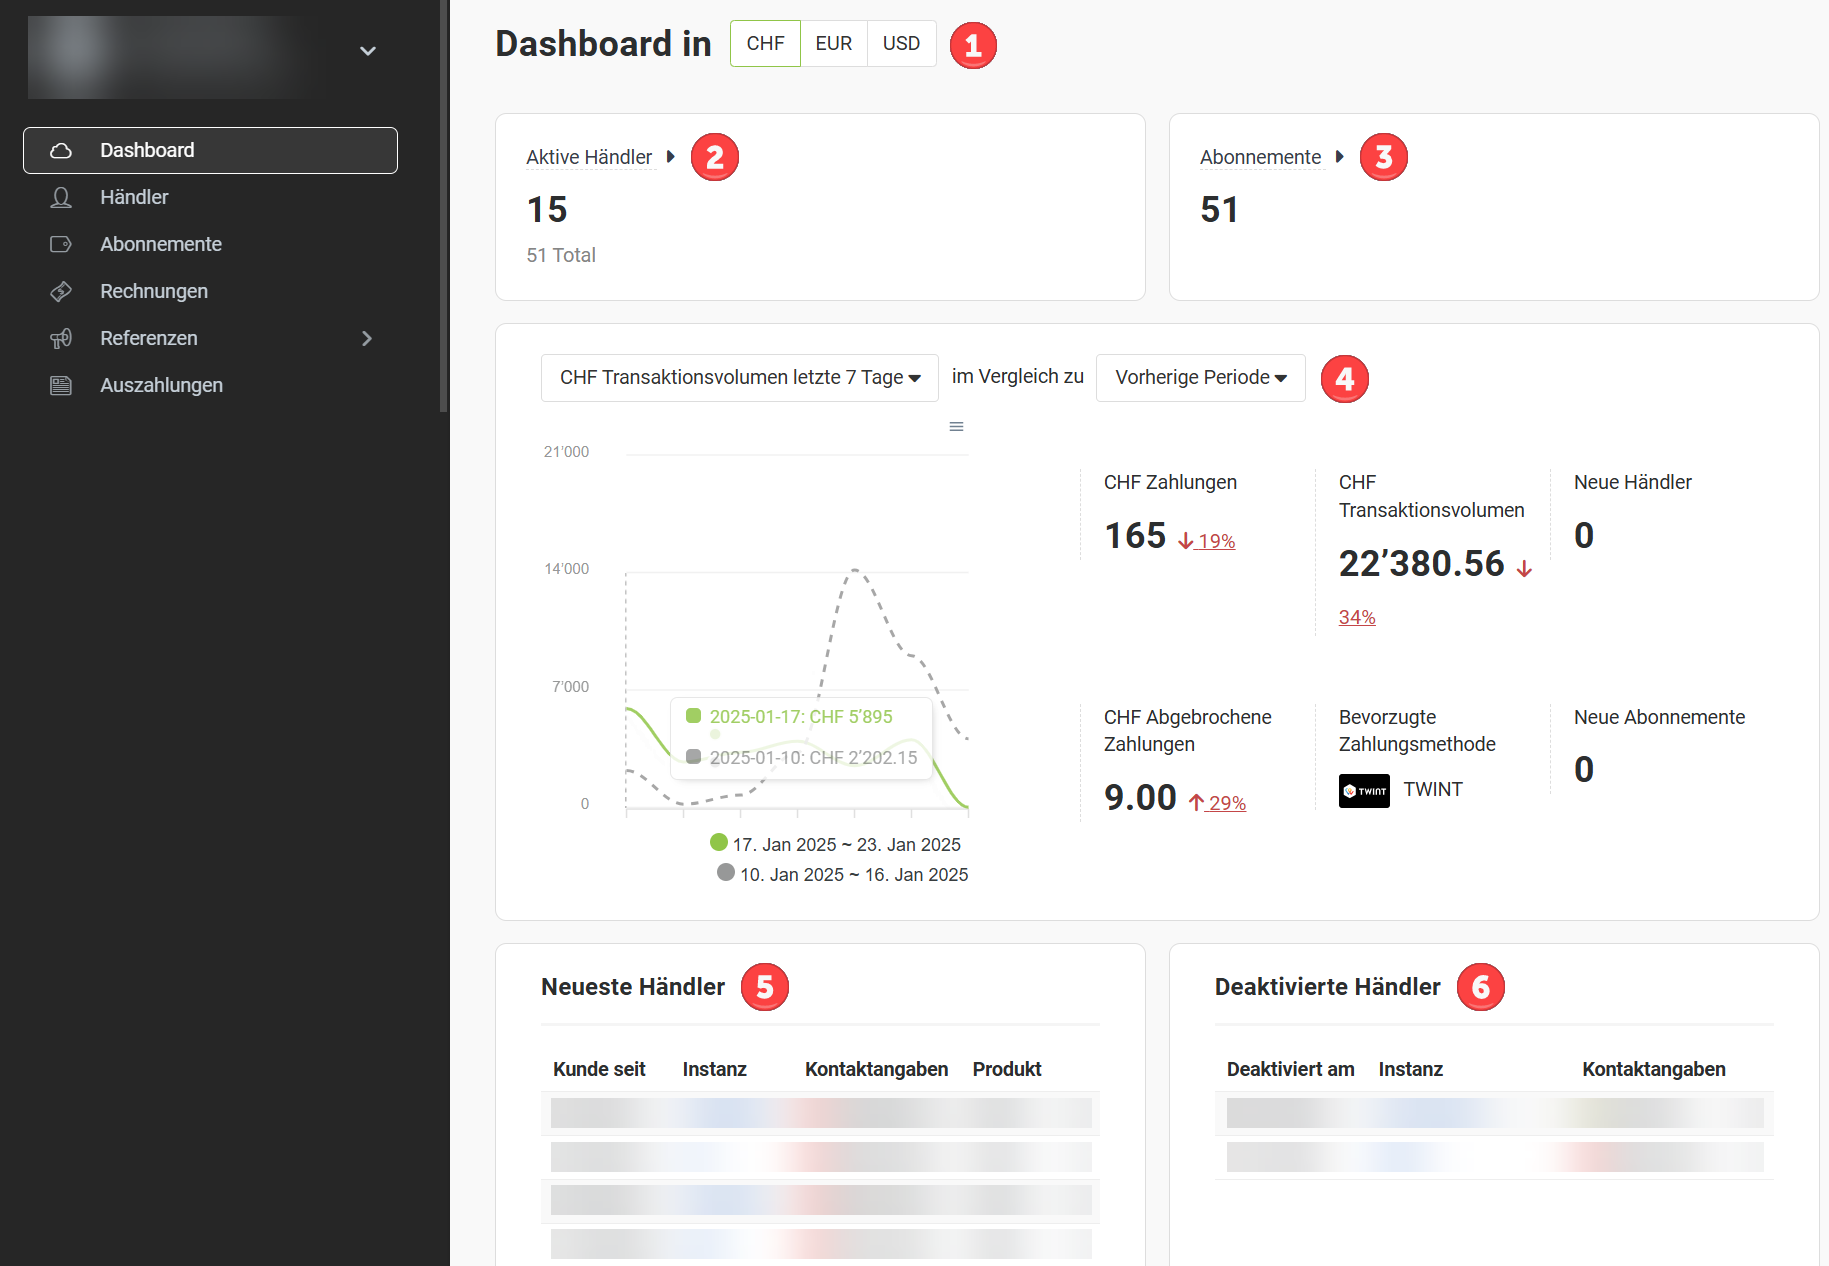
Das Dashboard bietet eine Übersicht der wichtigsten Kennzahlen zur Entwicklung Deines Geschäfts, wie zum Beispiel die Anzahl aktiver [Händler](/platform/backoffice/handler.md) und [Abonnemente](/platform/backoffice/abonnemente.md), die Anzahl [Transaktionen](/platform/analyse/transaktionen.md) und das Transaktionsvolumen pro Zeitraum:
Ansicht des Dashboards mit Statistiken und Kennzahlen zu Deiner Plattform
1. **Währung:** Wähle aus, ob das Dashboard in CHF, EUR oder USD angezeigt werden soll.
2. **Aktive Händler:** Zeigt die Anzahl aktiver Händler auf Deiner Plattform.
3. **Abonnemente:** Zeigt die Anzahl an Abonnemente auf Deiner Plattform.
4. **Statistiken:** In diesem Bereich werden Statistiken zur Anzahl von Transaktionen, zum Transaktionsvolumen und zu weiteren Daten angezeigt. Du kannst sowohl den zu analysierenden Zeitraum als auch den Vergleichszeitraum festlegen.
5. **Neueste Händler:** Liste der zuletzt hinzugefügten Händler.
6. **Deaktivierte Händler:** Liste der zuletzt deaktivierten Händler.
---
# Agent Instructions
This documentation is published with GitBook. GitBook is the documentation platform designed so that both humans and AI agents can read, navigate, and reason over technical content effectively. Learn more at gitbook.com.
## Querying This Documentation
If you need additional information that is not directly available in this page, you can query the documentation by asking a question.
Perform an HTTP GET request on the following URL with the `ask` and `goal` query parameters:
```
GET https://docs.payrexx.com/platform/backoffice/dashboard.md?ask=&goal=
```
`ask` is the immediate question: it should be specific, self-contained, and written in natural language.
`goal` is what the user is ultimately trying to achieve, the reason they need the answer. Sharing it helps GitBook give you a better, more relevant answer. A goal is most helpful when it describes the outcome the user wants rather than restating the question. For example, with `ask=how do I create an API token`, a goal like `automate deployments from our CI pipeline` lets GitBook tailor the answer to that use case.
The response will contain a direct answer to the question and relevant excerpts and sources from the documentation.
Use this mechanism when the answer is not explicitly present in the current page, you need clarification or additional context, or you want to retrieve related documentation sections.